Create histograms
Learn with an example
✈️ During Fitness Day at school, Mary and her classmates took part in a pull-up competition, keeping track of the results.
Use the data to complete the histogram below.
Pull-ups
1 2 3 4 4 9 18 19 19 20 21 23
✈️ Click to set the height of the missing bar.
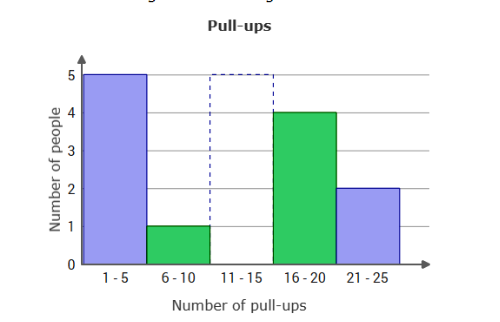
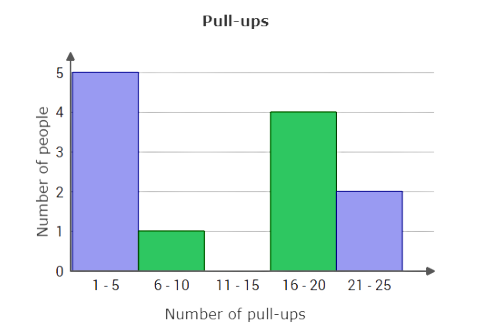
- The missing bar is for the range 11 – 15 pull-ups. Count the number of values in this range. 0 people did between 11 and 15 pull-ups. Set the height of the bar to 0.
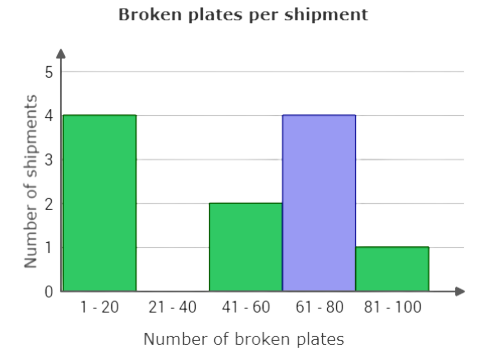
✈️ A pottery factory kept track of the number of broken plates per shipment last week.Use the data in the stem-and-leaf plot to complete the histogram below.
| Broken plates per shipment | |
| Stem | Leaf |
| 1 | 045 |
| 2 | 0 |
| 4 | 2 |
| 5 | 7 |
| 6 | 39 |
| 7 | 78 |
| 9 | 1 |
✈️ Click to set the height of a missing bar.
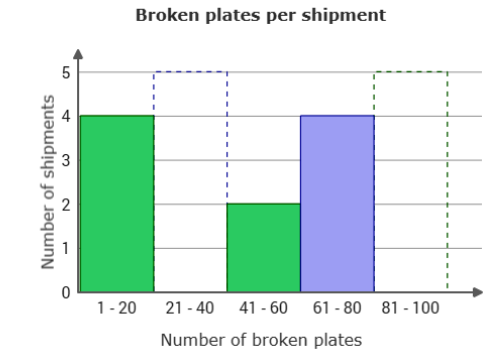
- The first bar is for the range 21 – 40 broken plates. Count the number of values in this range. 0 shipments had between 21 and 40 broken plates. Set the height of the bar to 0.
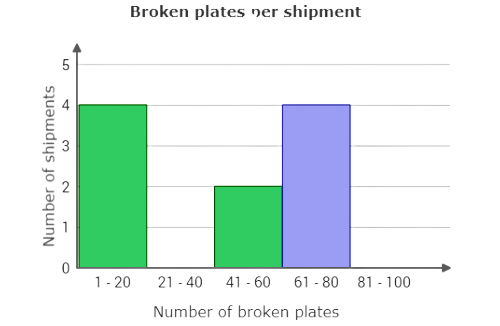
- The second bar is for the range 81 – 100 broken plate. Count the number of values in this range. 1 shipment had between 81 and 100 broken plates. Set the height of the bar to 1.
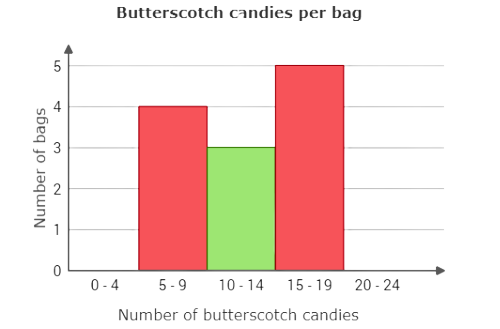
✈️ At a candy factory, butterscotch candies were packaged into bags of different sizes.Use the data in the stem-and-leaf plot to complete the histogram below.
| Butterscotch candies per bag | |
| Stem | Leaf |
| 0 | 5789 |
| 1 | 02455677 |
✈️ Click to set the height of a missing bar.
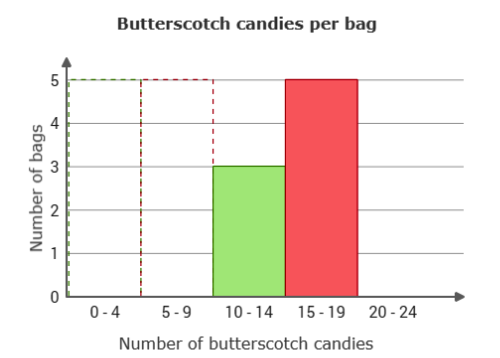
- The first bar is for the range 0 – 4 butterscotch candies. Count the number of values in this range. 0 bags had between 0 and 4 butterscotch candies. Set the height of the bar to 0.
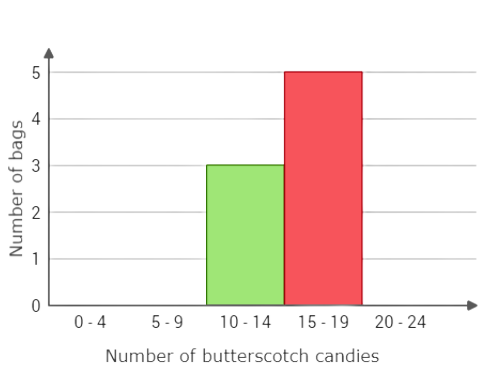
- The second bar is for the range 5 – 9 butterscotch candies. Count the number of values in this range. 4 bags had between 5 and 9 butterscotch candies. Set the height of the bar to 4.
Let’s practice!🖊️