Interpret histograms
Key Notes:
✈️ The height of each bar shows the number of bags in that range.
Learn with an example
🎯 A machine dispensed red gumdrops into bags of various sizes.
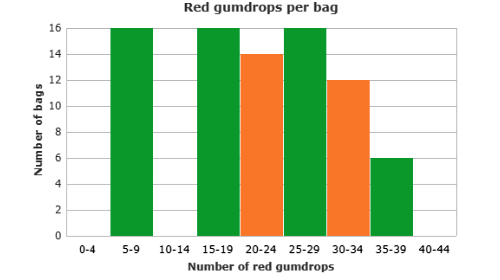
🎯Are there fewer bags that had 35-39 red gumdrops or bags that had 40-44 red gumdrops?
- 35-39 red gumdrops
- 40-44 red gumdrops
- Find the bar for the range 35-39 and the bar for the range 40-44. The bar for the range 40-44 is shorter.
- There are fewer bags that had 40-44 red gumdrops than bags that had 35-39 red gumdrops.
🎯 For a science fair project, Colette tracked the temperature each day.
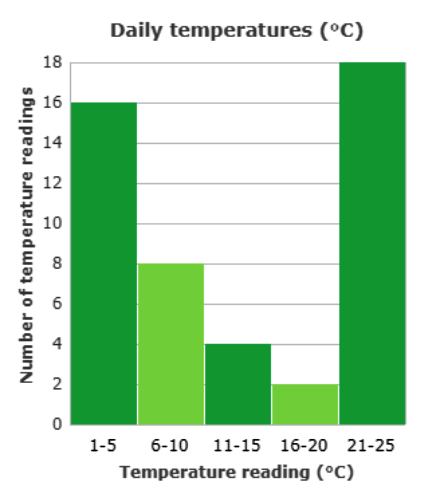
🎯 How many temperature readings were between 1°C and 5°C?
________ temperature readings
- Find the bar for the range 1-5°C. Using the scale on the left side of the graph, read the height of the bar. The height of the bar is 16.
- 16 temperature readings were between 1°C and 5°C.
🎯 In a study on public parking, the director of transportation counted the number of cars in each of the city’s car parks.
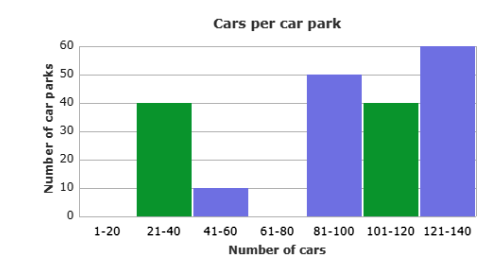
🎯 How many car parks are there in all?_______ car parks
- Read the height of each bar off the graph.
| Cars per car park | |
| Number of cars | Number of car parks |
| 1-20 | 0 |
| 21-40 | 40 |
| 41-60 | 10 |
| 61-80 | 0 |
| 81-100 | 50 |
| 101-120 | 40 |
| 121-140 | 60 |
- Add to find the total number of car parks.
| 0 + 40 + 10 + 0 + 50 + 40 + 60 | = | 200 |
- There are 200 car parks.
Let’s practice!🖊️