Match quadratic functions and graphs
Key Notes :
Understanding Quadratic Functions and Graphs
- A quadratic function is a polynomial function of degree two, typically expressed in the form f(x) = ax² + bx + c.
- The graph of a quadratic function is a parabola, which is a U-shaped curve.
Key Properties of Quadratic Graphs
- Leading Coefficient (a): Determines the direction of the parabola (upward if a > 0, downward if a < 0).
- Vertex: The point where the parabola changes direction (minimum if a > 0, maximum if a < 0).
- Axis of Symmetry: A vertical line that divides the parabola into two symmetrical halves.
- Roots: The points where the parabola intersects the x-axis (also known as x-intercepts).
- Y-intercept: The point where the parabola intersects the y-axis.
Matching Quadratic Functions and Graphs
- Analyze the Leading Coefficient: Determine whether the parabola opens upward or downward based on the sign of the leading coefficient (a).
- Identify the Vertex: Look for the highest or lowest point on the graph. This is the vertex.
- Determine the Axis of Symmetry: Find the vertical line that divides the parabola into two symmetrical halves.
- Identify the Roots: Look for the points where the parabola intersects the x-axis.
- Check the Y-intercept: Find the point where the parabola intersects the y-axis.
Example
Match the quadratic function f(x) = -2x² + 4x – 1 with its graph.
- Leading Coefficient: a = -2, so the parabola opens downward.
- Vertex: The vertex can be found using the formula (-b/2a, f(-b/2a)) = (1, 1).
- Axis of Symmetry: x = 1.
- Roots: Solve -2x² + 4x – 1 = 0 to find x = 1/2 and x = 1.
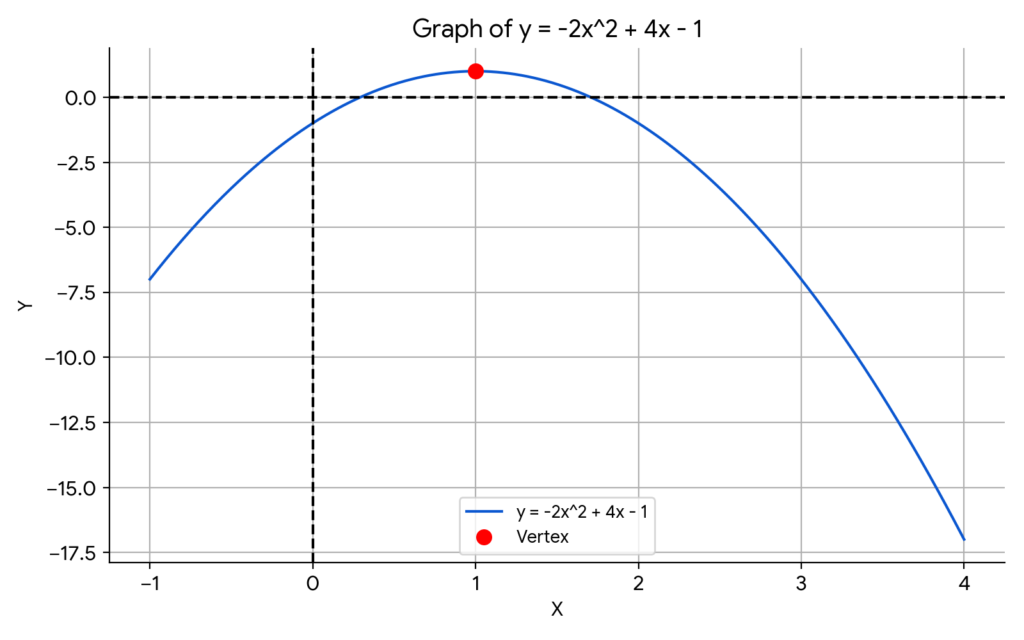
By analyzing these properties, you can match the function with the appropriate graph.
Learn with an example
Match each quadratic function to its graph.
To determine which function describes which graph, look at their leading coefficients.
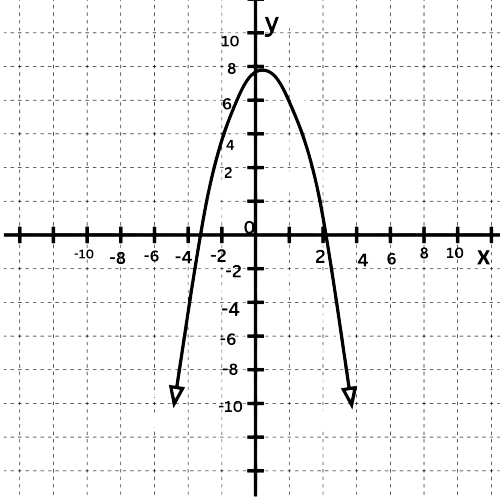
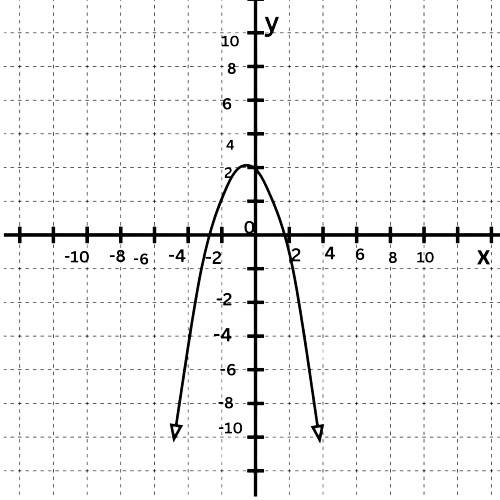
f(x)=–2x2–4x+6
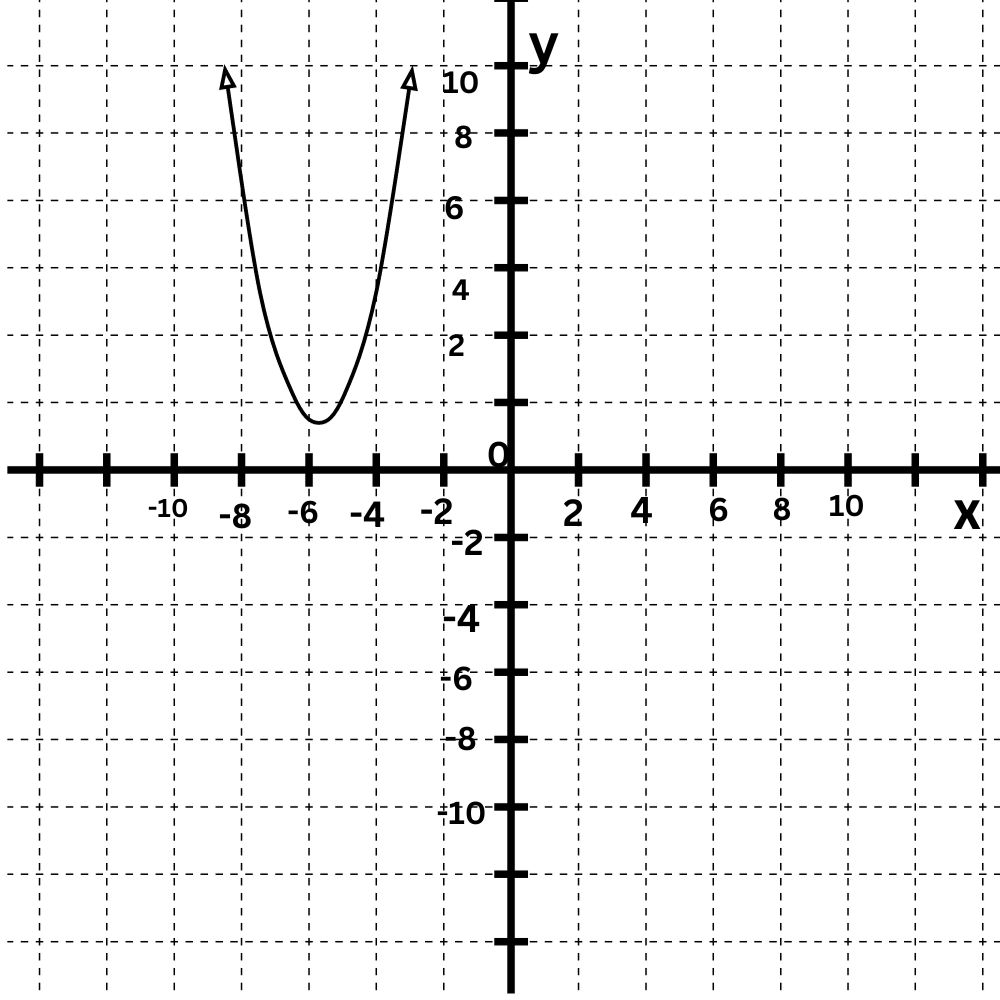
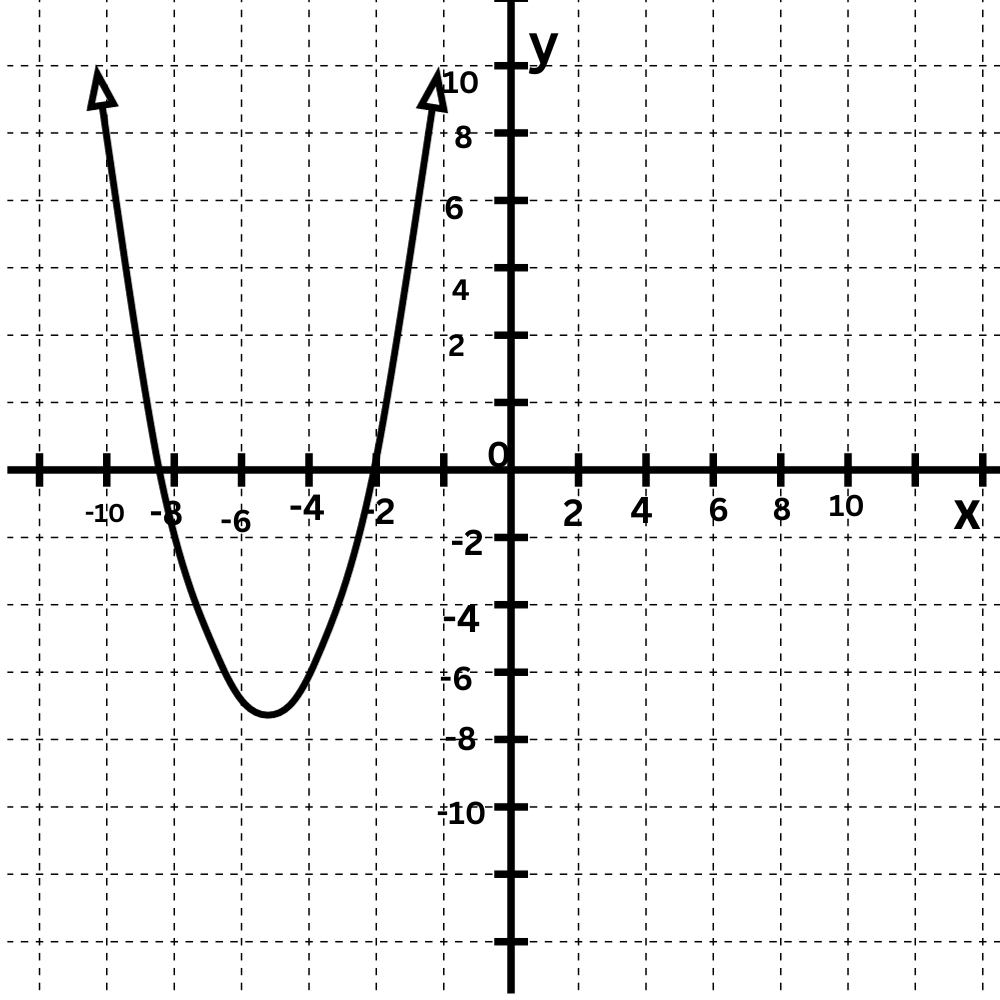
g(x)=1x2+10x+26
The leading coefficient of f(x) is negative, so its graph opens down.
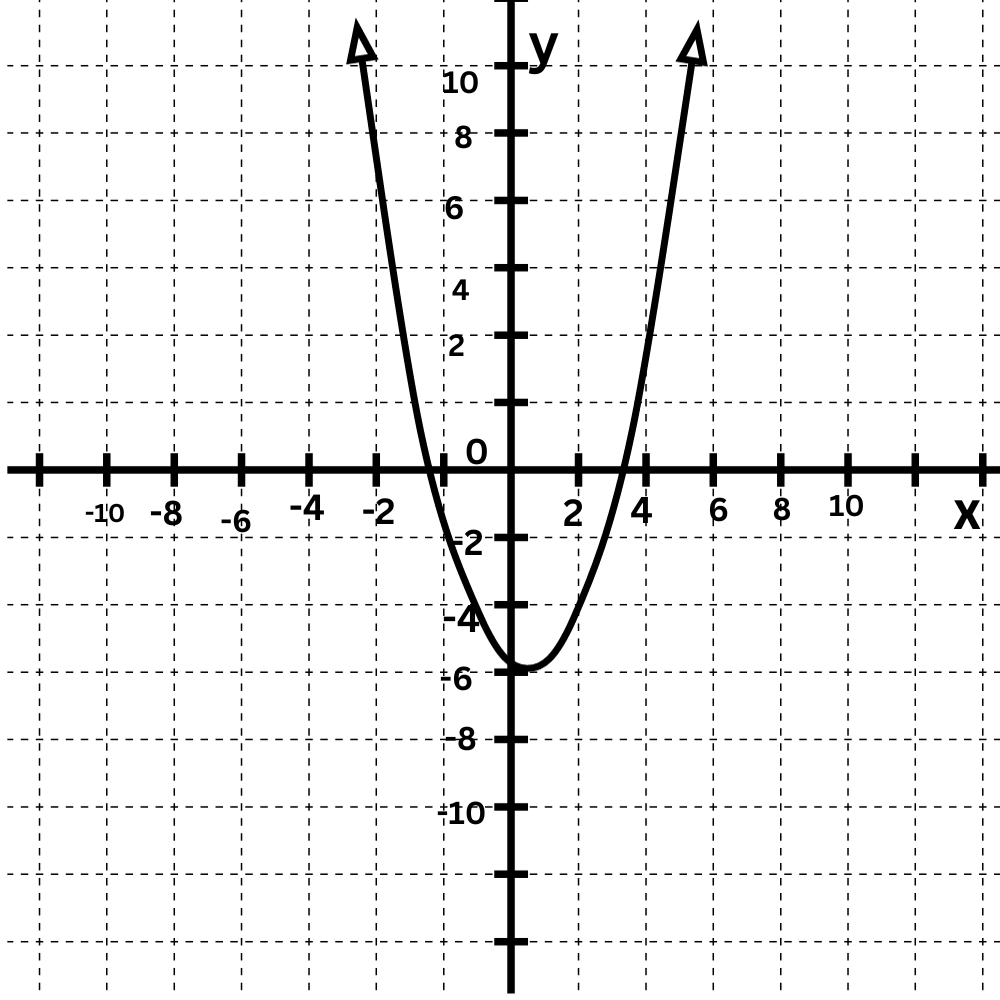
The leading coefficient of g(x) is positive, so its graph opens up.
Match f(x) and g(x) to their graphs.
Match each quadratic function to its graph.
To determine which function describes which graph, look at their leading coefficients.
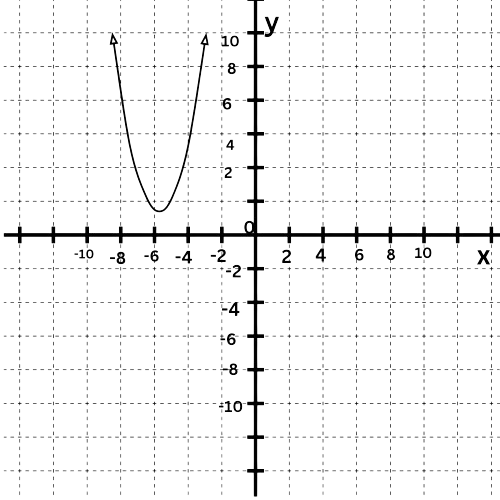
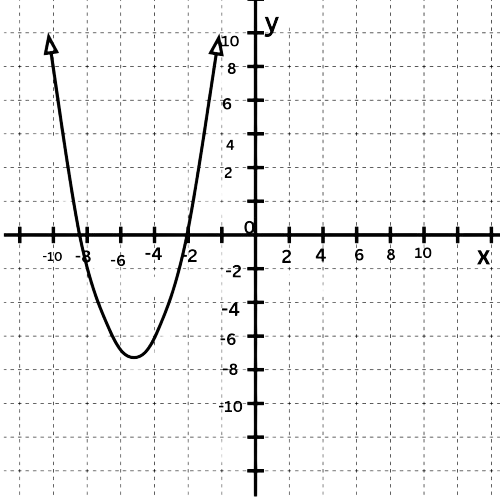
f(x)=1x2+10x+18
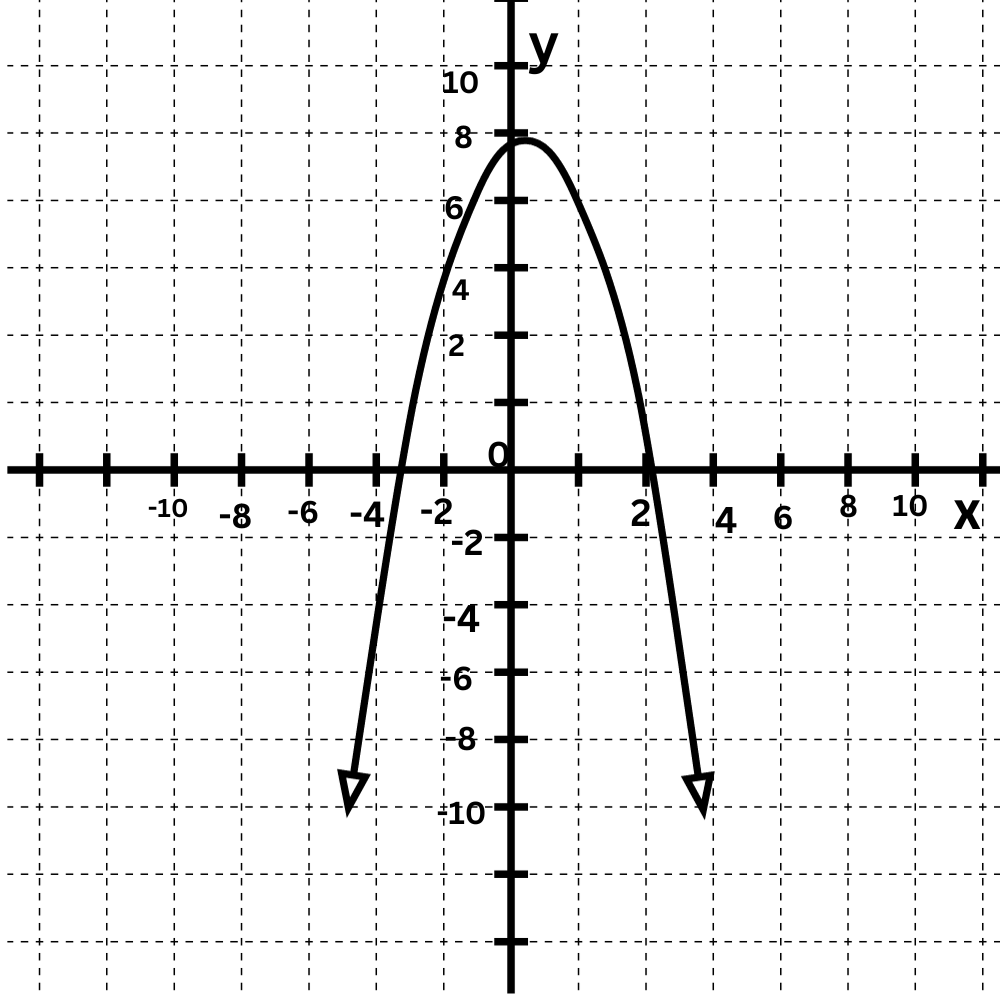
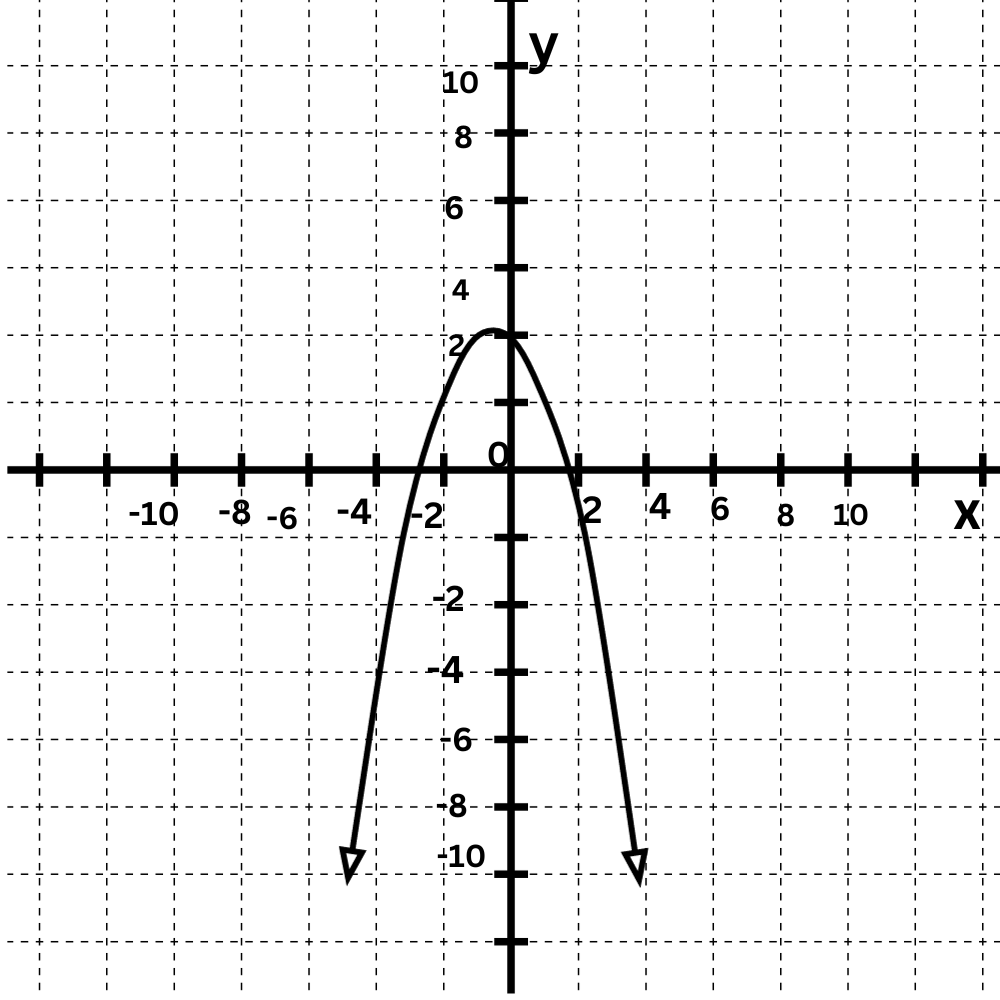
g(x)=–1x2+2
The leading coefficient of f(x) is positive, so its graph opens up.
The leading coefficient of g(x) is negative, so its graph opens down.
Match f(x) and g(x) to their graphs.
Match each quadratic function to its graph.
To determine which function describes which graph, look at their leading coefficients.
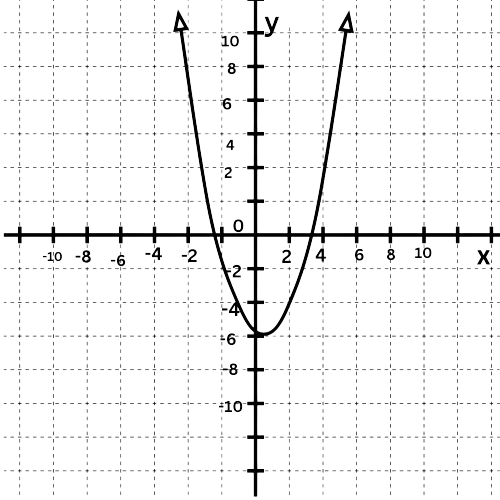
f(x)=2x2–4x–4
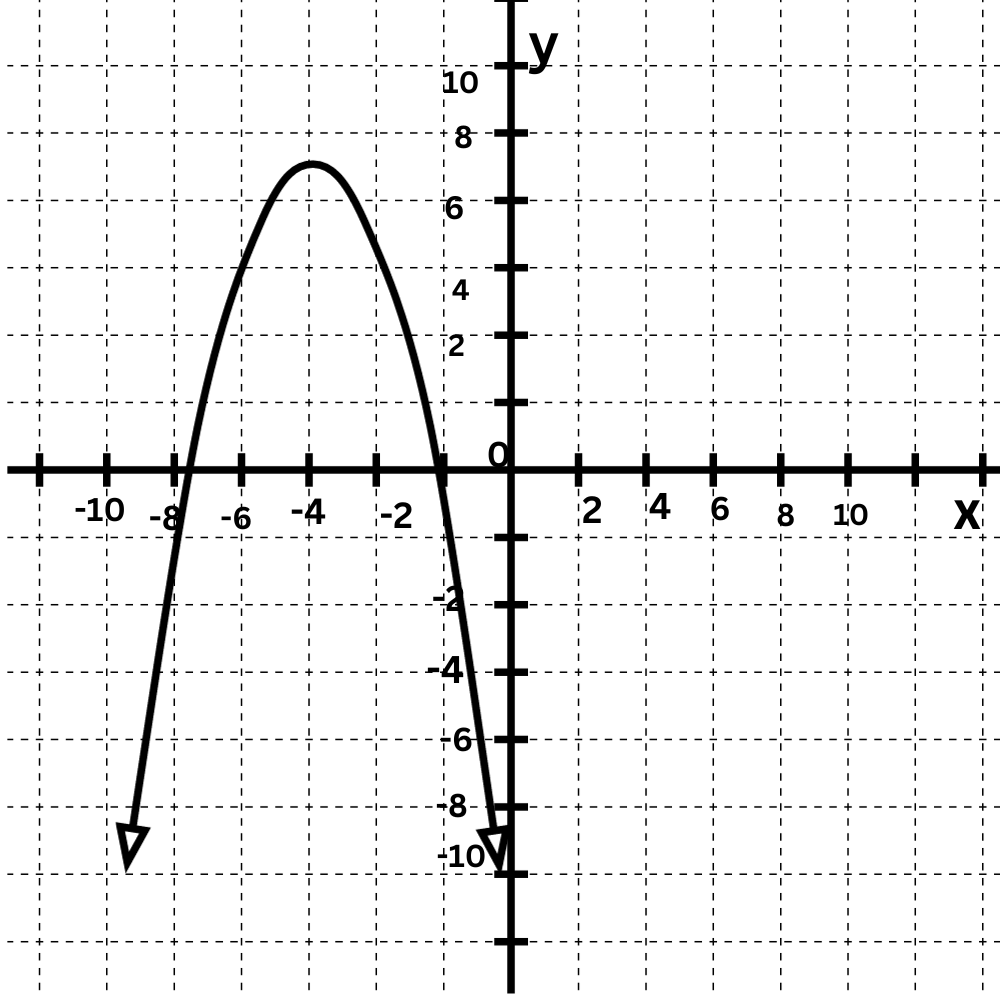
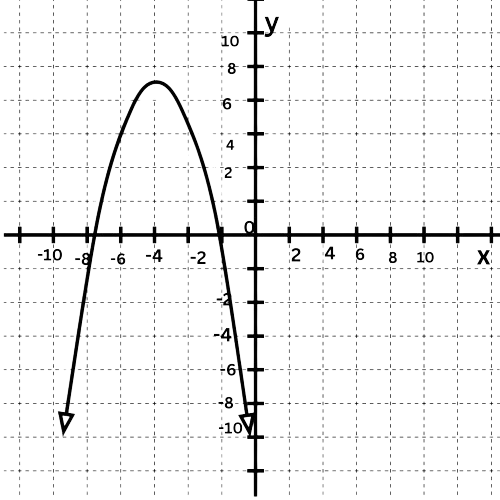
g(x)=–1x2–8x–9
The leading coefficient of f(x) is positive, so its graph opens up .The leading coefficient of g(x) is negative, so its graph opens down . Match f(x) and g(x) to their graphs.
let’s practice!