Graph a quadratic equation
Key Notes :
Understanding Quadratic Equations and Graphs
- A quadratic equation is a polynomial equation of degree two, typically expressed in the form ax² + bx + c = 0.
- The graph of a quadratic equation is a parabola, which is a U-shaped curve.
Key Properties of Quadratic Graphs
- Vertex: The point where the parabola changes direction.
- Axis of Symmetry: A vertical line that divides the parabola into two symmetrical halves.
- Roots: The points where the parabola intersects the x-axis (also known as x-intercepts).
- Y-intercept: The point where the parabola intersects the y-axis.
Steps to Graph a Quadratic Equation
- Identify the Vertex: Use the vertex formula: (-b/2a, f(-b/2a)) to find the coordinates of the vertex.
- Determine the Axis of Symmetry: The axis of symmetry is a vertical line passing through the vertex. Its equation is x = -b/2a.
- Find the Roots (if any): Solve the quadratic equation to find the x-intercepts. You can use factoring, completing the square, or the quadratic formula.
- Plot Key Points: Plot the vertex, the axis of symmetry, and any roots you found.
- Sketch the Parabola: Use the shape of the parabola (upward if a > 0, downward if a < 0) and the plotted points to sketch the curve.
Example
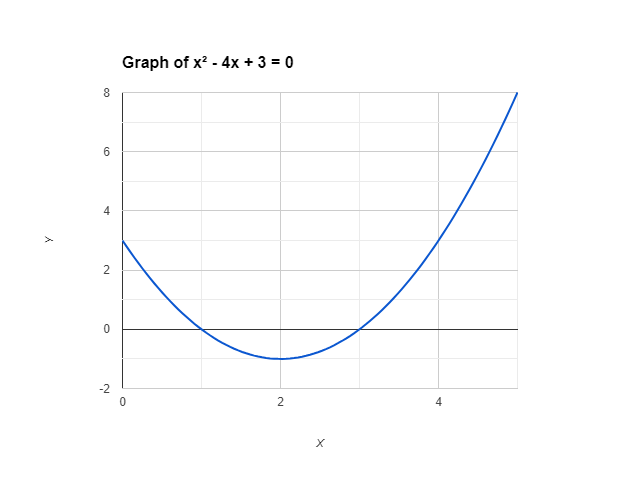
Graph the quadratic equation f(x) = x² – 4x + 3
- Vertex: (-b/2a, f(-b/2a)) = (2, -1)
- Axis of Symmetry: x = 2
- Roots: Solve x² – 4x + 3 = 0 to find x = 1 and x = 3
- Sketch the parabola using the vertex, axis of symmetry, and roots.
Additional Tips
- To get a more accurate graph, plot additional points by substituting different x-values into the equation and calculating the corresponding y-values.
- Consider the end behavior of the parabola: if a > 0, the parabola opens upward, and if a < 0, the parabola opens downward.
- Use graphing technology (e.g., graphing calculators or online graphing tools) to visualize the graph more easily
Learn with an example
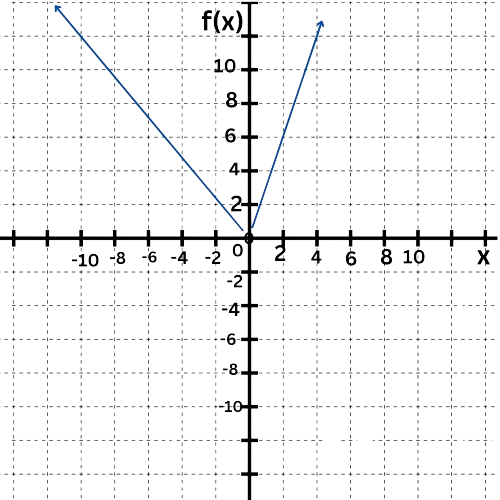
Graph the function f(x)=6x2.
Plot the vertex. Then plot another point on the parabola. If you make a mistake, you can erase your parabola by selecting the second point and placing it on top of the first.

To graph the parabola, first find the vertex.
f(x)=6x2
=6(x–0)2+0
The vertex is (0,0), which is the origin.
Now look for another point on the parabola with integer or half-integer coordinates. One such point is (1/2,3/2). (Plugging in x=1/2 yields y=3/2.) So, plot this point.
Graph the function f(x)=7x2.
Plot the vertex. Then plot another point on the parabola. If you make a mistake, you can erase your parabola by selecting the second point and placing it on top of the first.
To graph the parabola, first find the vertex.
f(x)=7x2
=7(x–0)2+0
The vertex is (0,0), which is the origin.
Now look for another point on the parabola with integer or half-integer coordinates. One such point is (1,7). (Plugging in x=1 yields y=7.) So, plot this point.
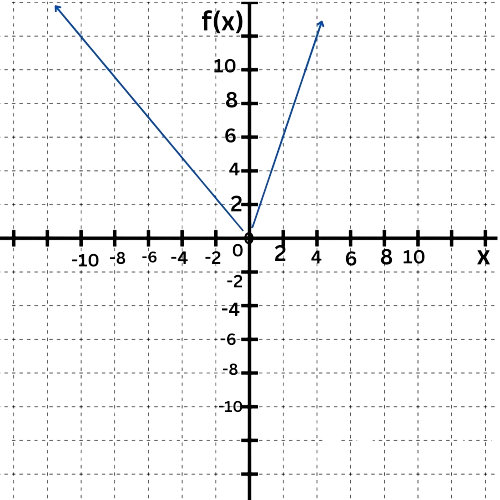
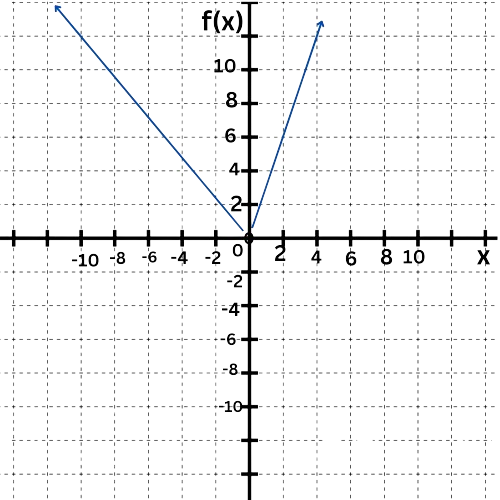
Graph the function f(x)=5x2.
Plot the vertex. Then plot another point on the parabola. If you make a mistake, you can erase your parabola by selecting the second point and placing it on top of the first.
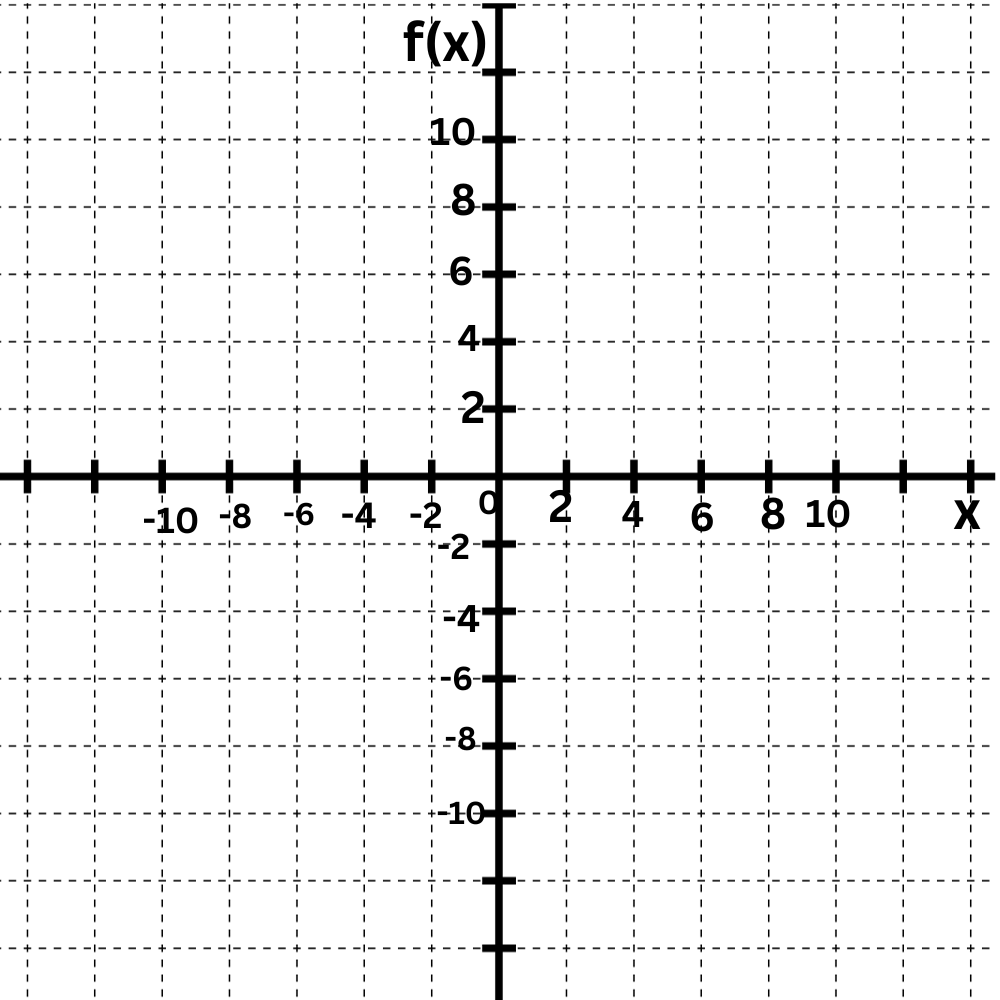
To graph the parabola, first find the vertex.
f(x)=5x2
=5(x–0)2+0
The vertex is (0,0), which is the origin.
Now look for another point on the parabola with integer or half-integer coordinates. One such point is (1,5). (Plugging in x=1 yields y=5.) So, plot this point.
let’s practice!

