Slope-intercept form: graph an equation
Key Notes:
Slope=change in y /change in x
- The coordinates of the y-intercept are (0, y), where y is the y-intercept.
- In the equation y = mx + b, m is the slope and b is the y-intercept.
Learn with an example
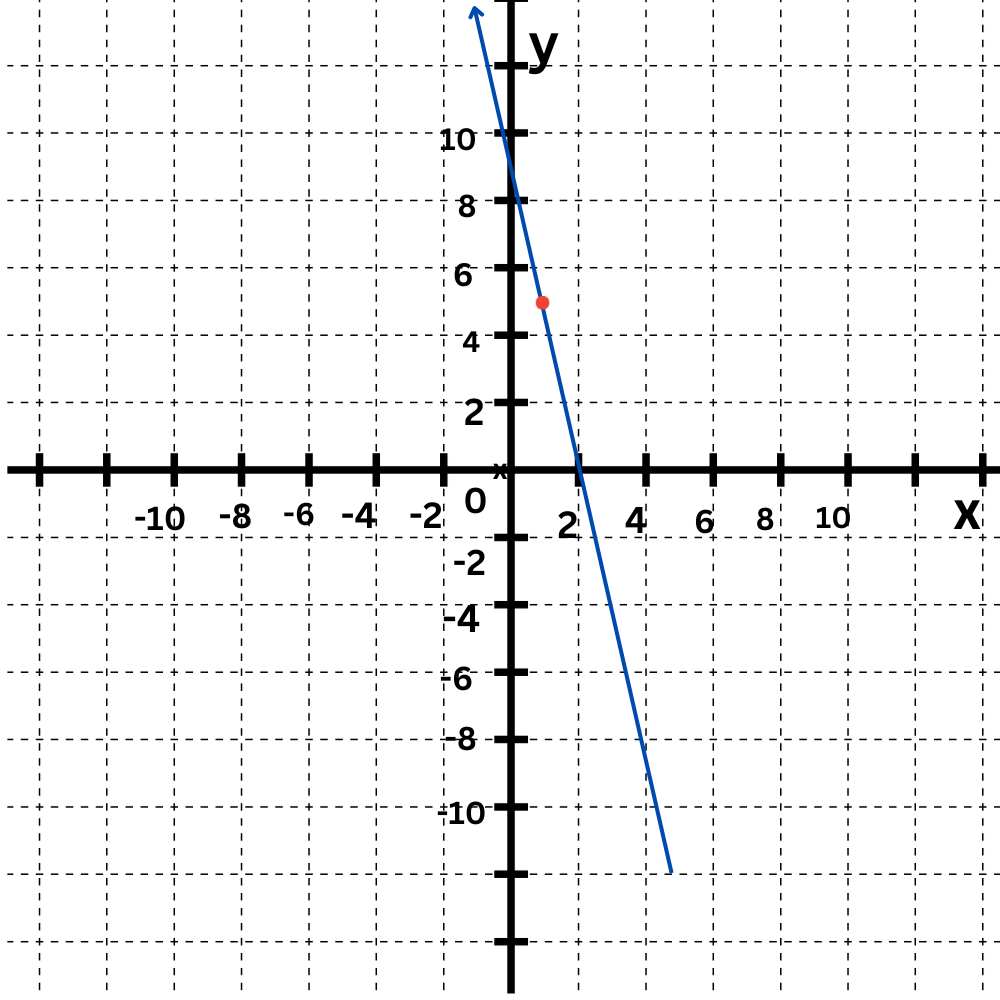
Graph this line using the slope and y-intercept:
y = –5x + 10
The graph is the straight line connecting ( 0,10 ) and ( 1,5 ).
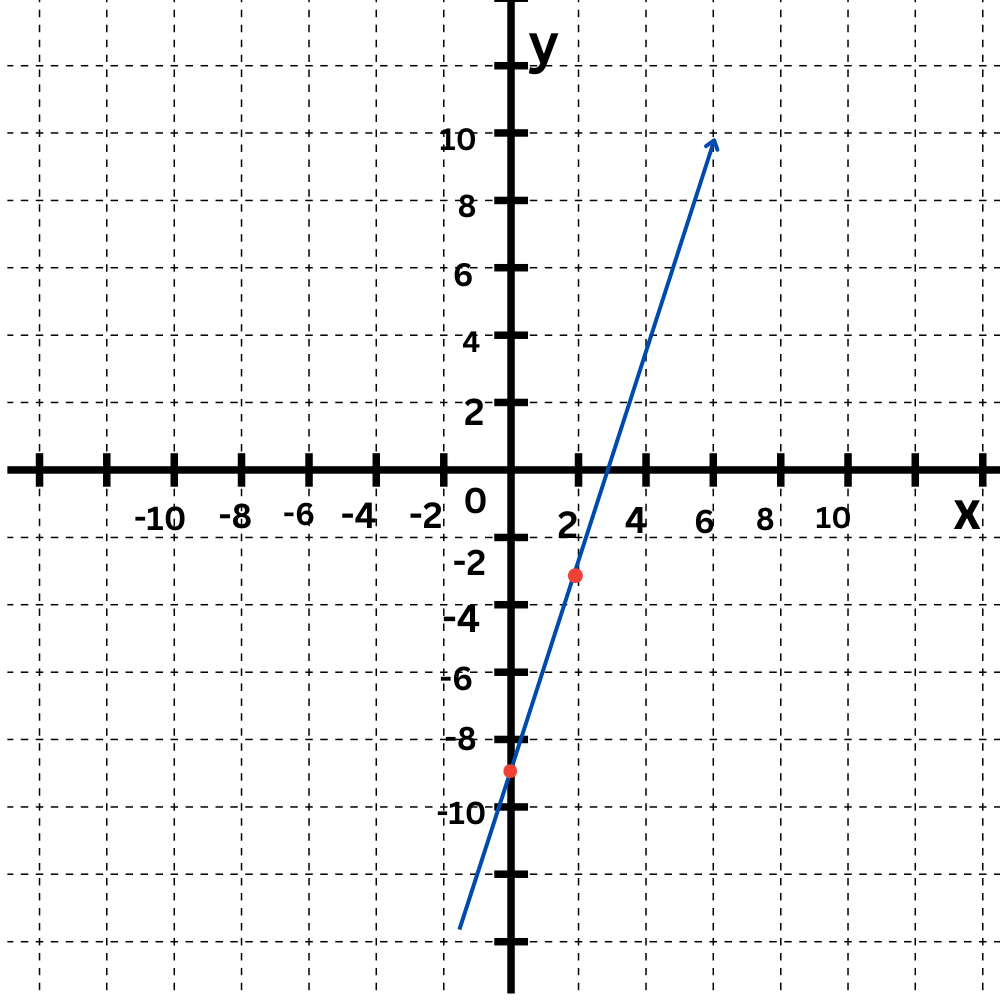
Graph this line using the slope and y-intercept:
y = 6x -9
The graph is the straight line connecting ( 0,-9 ) and ( 1,-3 ) .
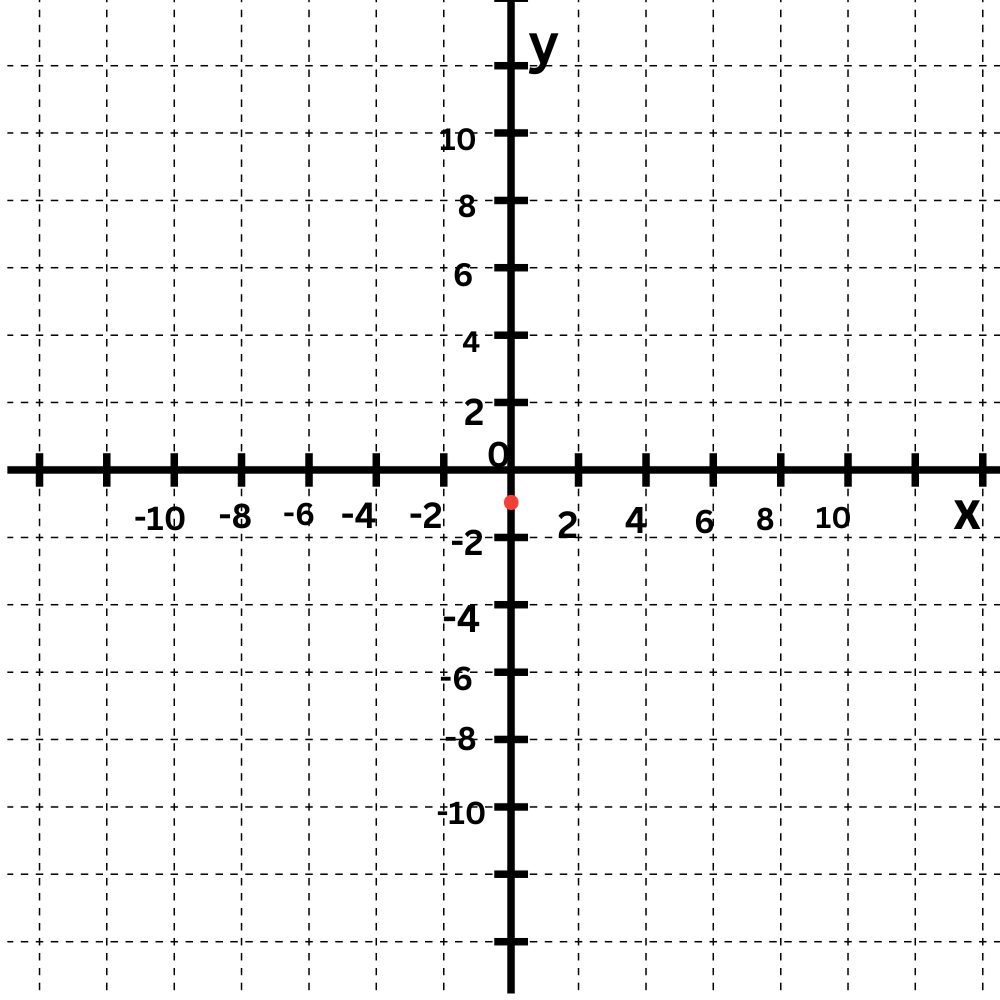
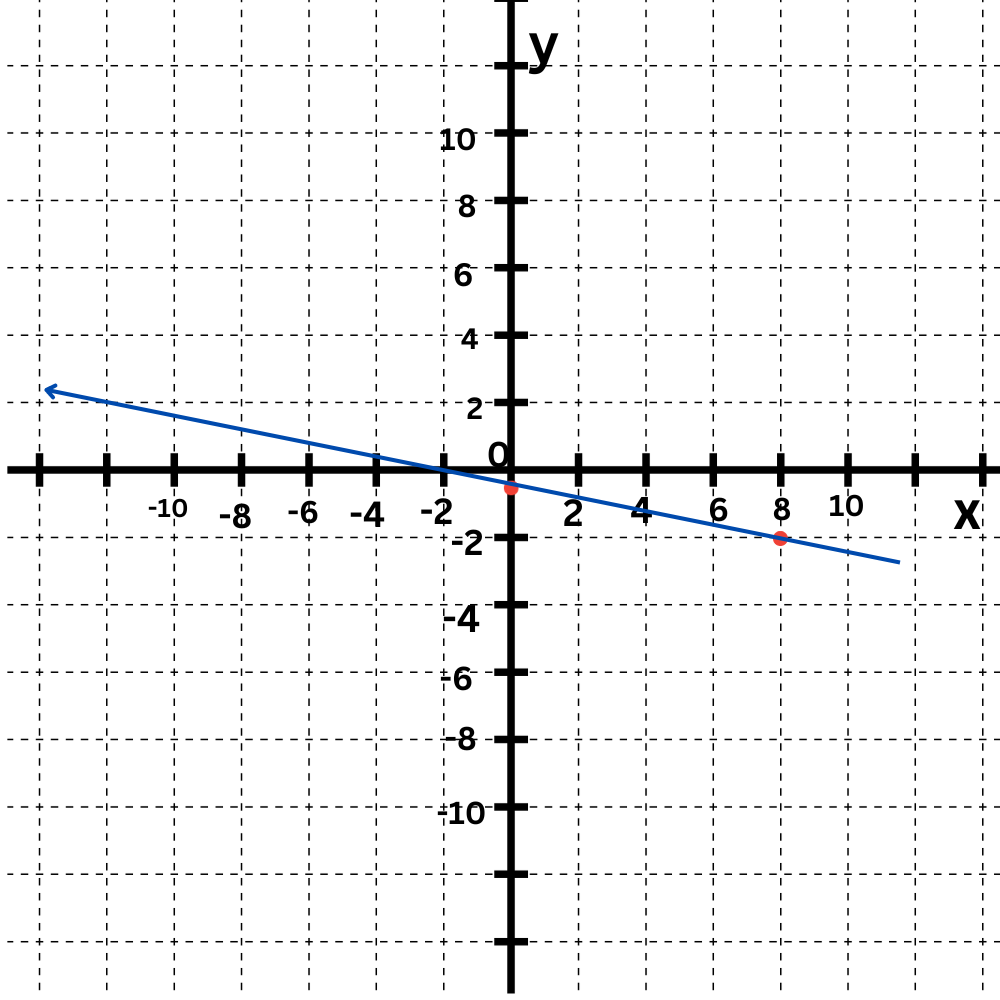
Graph this line using the slope and
y-intercept:
y = -1/8x – 1
Click to select points on the graph.
The y-intercept is -Plot the point (0, -1 ) .
The slope is -1/8 . Move down 1 and right 8 to find another point on the line.
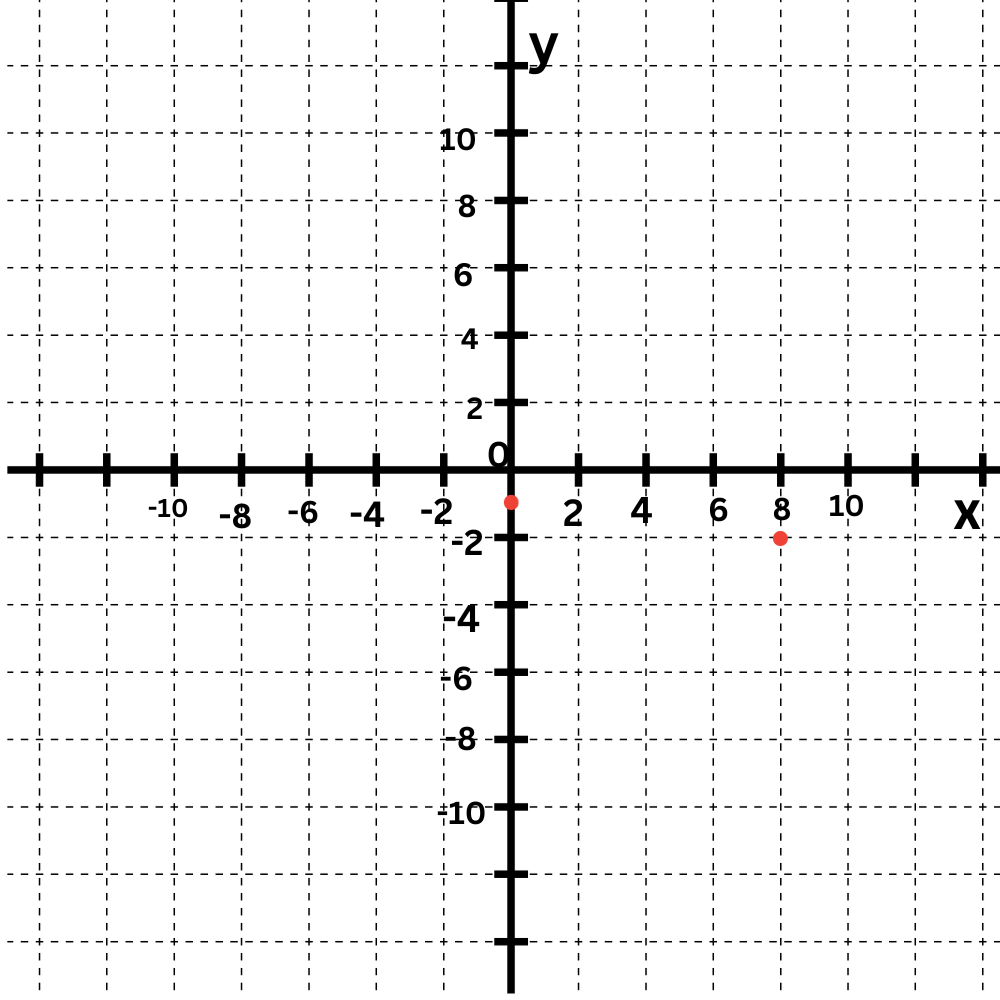
The graph is the straight line connecting (0,1) and (8, -2).
Let’s Practice!