Graph a horizontal or vertical line
key notes:
The graph of x=3 is a vertical line. every x value is 3, including the x-intercept
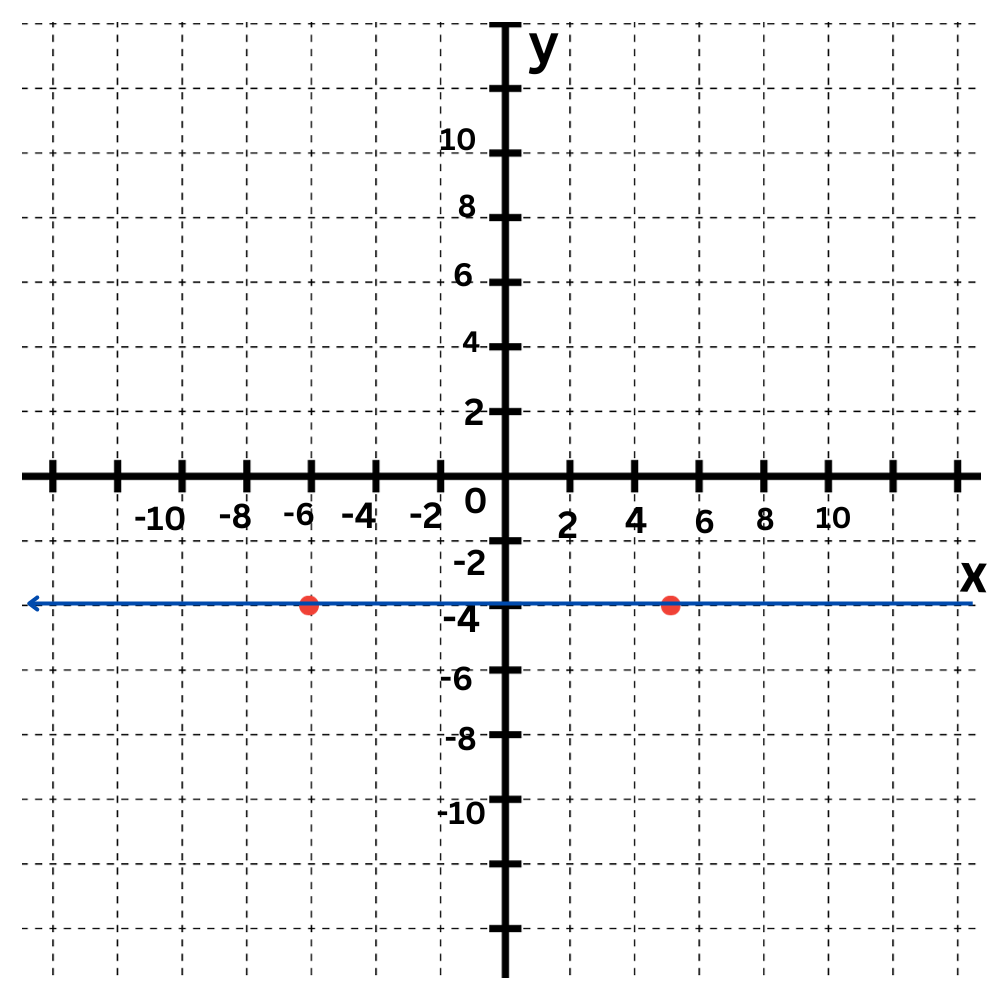
Graphing a Horizontal Line:
- A horizontal line is parallel to the x-axis.
- The equation of a horizontal line is of the form y = k, where k is a constant.
- The y-coordinate remains constant for all points on a horizontal line.
- To graph a horizontal line, locate the y-intercept (where it crosses the y-axis) and draw a straight line through that point.
Graphing a Vertical Line:
- A vertical line is parallel to the y-axis.
- The equation of a vertical line is of the form x = h, where h is a constant.
- The x-coordinate remains constant for all points on a vertical line.
- To graph a vertical line, locate the x-intercept (where it crosses the x-axis) and draw a straight line through that point.
Example:
- Graph the equation y = 3. It represents a horizontal line where every point on the line has a y-coordinate of 3.
Important Tips:
- Remember that a horizontal line has a slope of 0, and a vertical line has an undefined slope.
- Pay attention to the intercepts (x-intercept for vertical lines, y-intercept for horizontal lines) when graphing.
- Use a ruler to ensure straight lines when drawing the graph.
Applications:
- In real-world problems, horizontal and vertical lines might represent constant values or limits in various contexts.
- In physics, vertical lines can represent time while horizontal lines can represent constant values like velocity.
Learn with an example
Graph this equation:
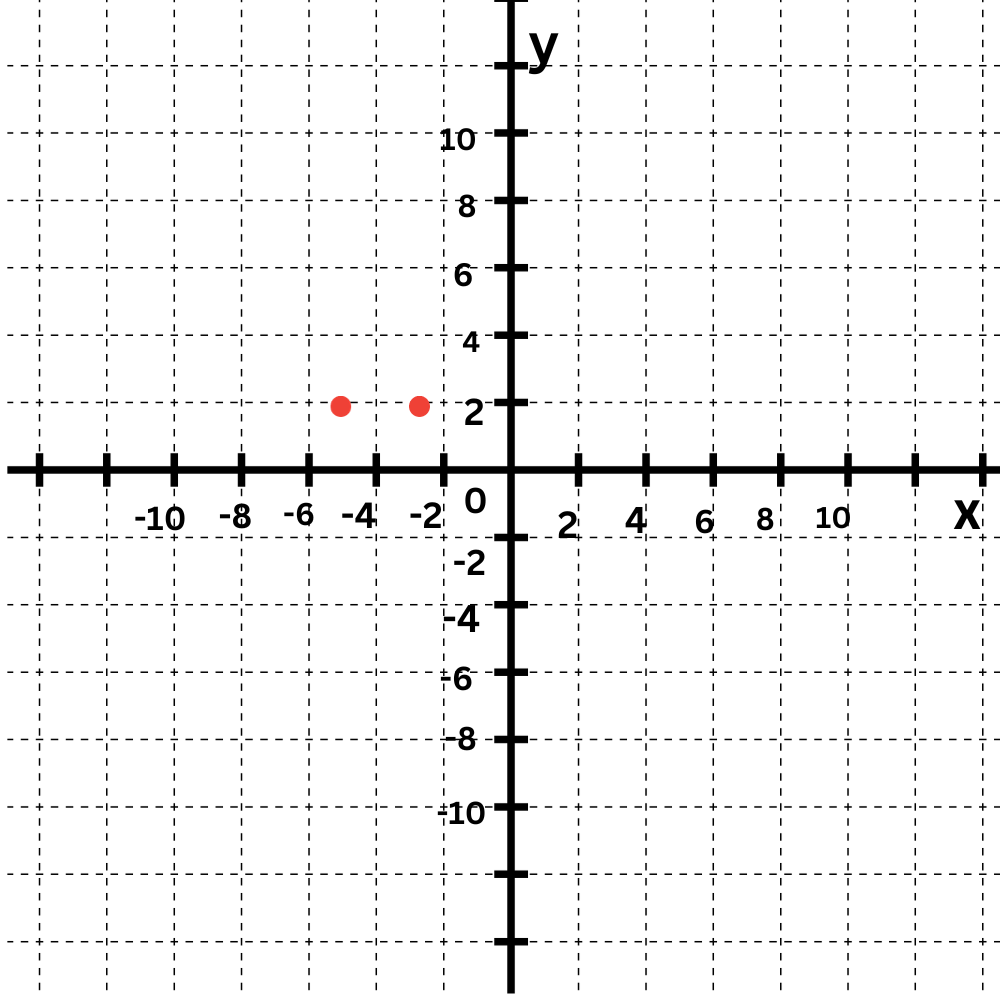
y=2
Click to select points on the graph.
The equation y=2 tells you that every y-value is 2.
First plot some points that have a y-value of 2, such as (–3,2) and (–1,2).
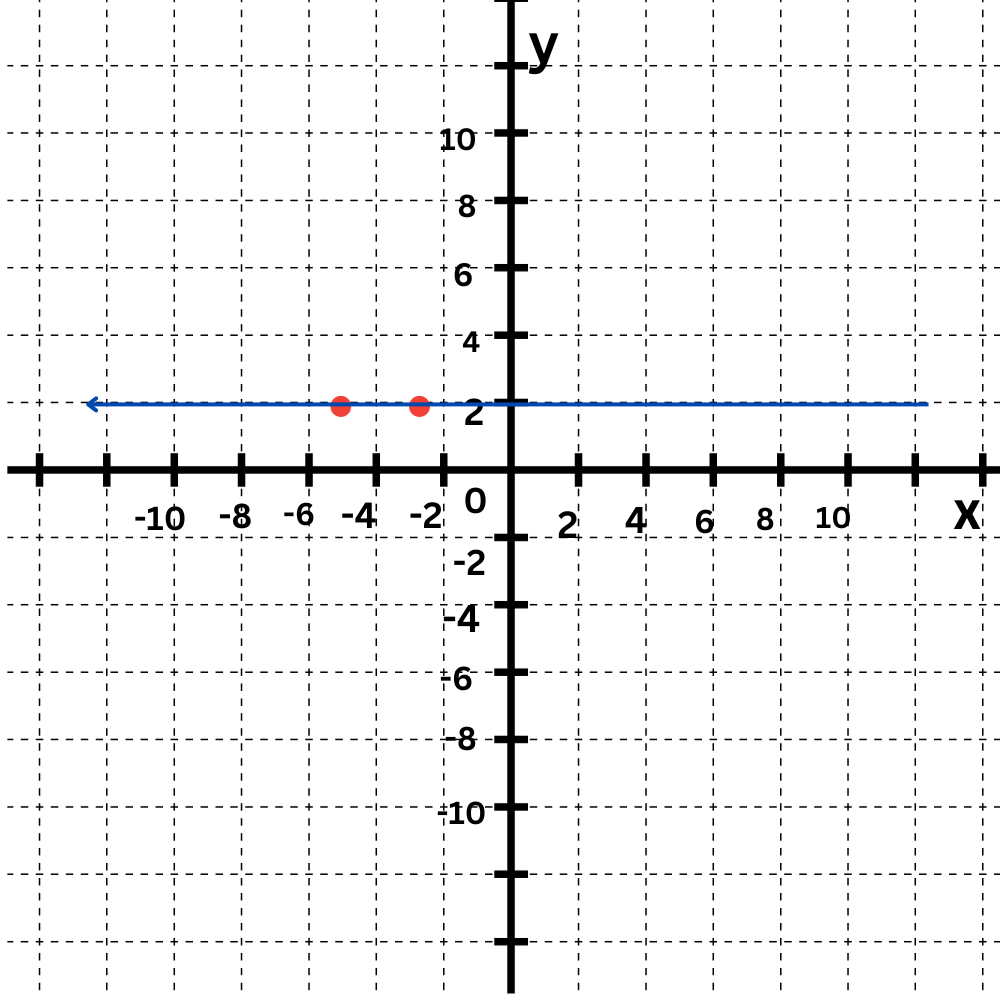
Now draw a line connecting the points.
Graph this equation:
Click to select points on the graph
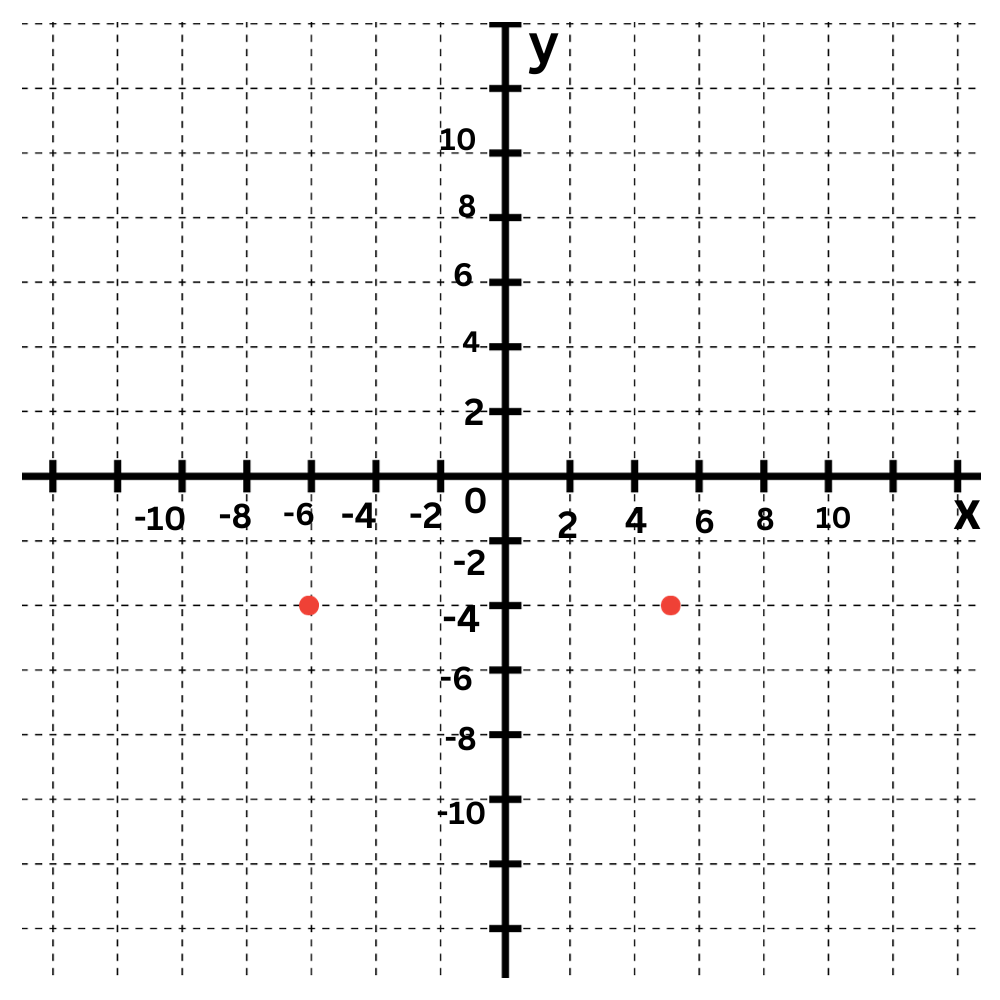
y=–6
💡The graph of y=–6 is a horizontal line. Every y-value is –6, including the y-intercept.
The equation y=–6 tells you that every y-value is –6.
First plot some points that have a y-value of –6, such as (–4,–6) and (5,–6).
Now draw a line connecting the points.
Let’s Practice!